High Temperature Observation
of Glass Melting Process
We provide High Temperature Observation (HTO) of processes in molten glass:
- Visual observation of processes in molten glass in connection with computer Image Analysis
- Quantitative evaluation of phenomena in communication with Image Analysis
- Data and gas property measurements for the mathematical models of bubble behavior
and model verifications
Typical HTO tests are focused mainly on:
- Refractory tests – comparison of different materials for glass contact
- Refining tests – optimization of batch composition or comparison of different batches
- Fining tests – at different pressures or with introduction of various gases to the atmosphere
- Bubble growth/shrinking tests – at different temperature and times through the melting process
- … and many other specialized tests based on customer requirements

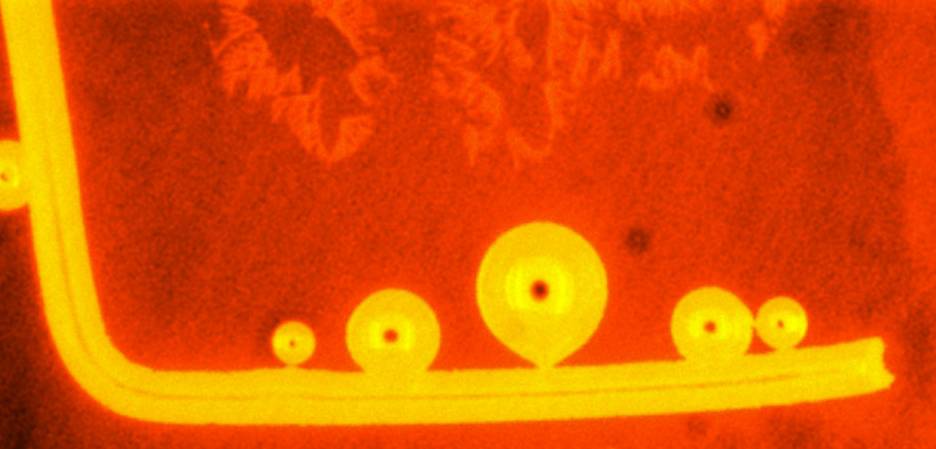
Nucleation of bubbles
Methods of high-temperature observation and image analysis were used to determine the temperature at which bubbles nucleate at a platinum wire immersed in the glass melt.
Bubbles growing during slow linear increase in temperature were identified and their diameter measured.
The dependence between the diameter of bubbles and the temperature was extrapolated to zero size of the respective bubbles, and thus determines the temperature of nucleation.
Example: Batch Melt Test Vizualization
Original batch & three modifications to improve melting & fining ability
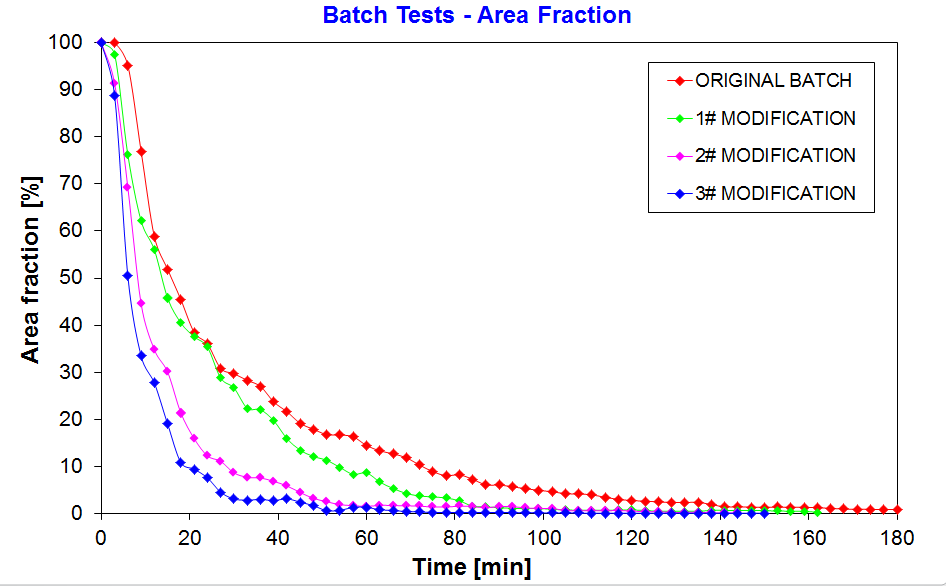
Quantitative evaluation of batch melt test
1│Area fraction – Areas occupied by inhomogeneities
This parameter is evaluated by image analysis software and it represents the fraction of the recorded image of the melt free area depending on time and expressed as a percentage.
Bubbles are seen as white areas or single objects; the melt is dark or even black.
2│Number of bubbles
Number of bubbles being evaluated at the recorded images in the second half of the test, when bubbles became separated objects and the evaluation was therefore possible.
The graphical representation shows dependence of bubbles count on time.
3│Development of mean bubble sizes during the course of the test
Fining ability of the tested batches should be better with higher mean bubble size, because the bubbles ascend to the level faster.
The graphical representation shows development of average bubbles diameter in dependence on time.
4│Bubble growth rate
After the melting/fining tests are completed as well as the glass melt fined, the specifically developed method is used for determination of the bubble growth rate.
An artificially generated CO2 bubble into the melt is applied to measure the bubble growth rate.
According to our experience, this parameter is the best reflecting the fining process itself.
We have seen that the higher bubble growth rate showed the better fining ability of the tested batch.
The detailed evaluation can be found in provided chart.
Based on our practical experience, the fining process is running quite efficiently, when a bubble growth rate is higher than value of 1 x 10⁻⁶ m/s at a melting temperature (red dashed line in chart).
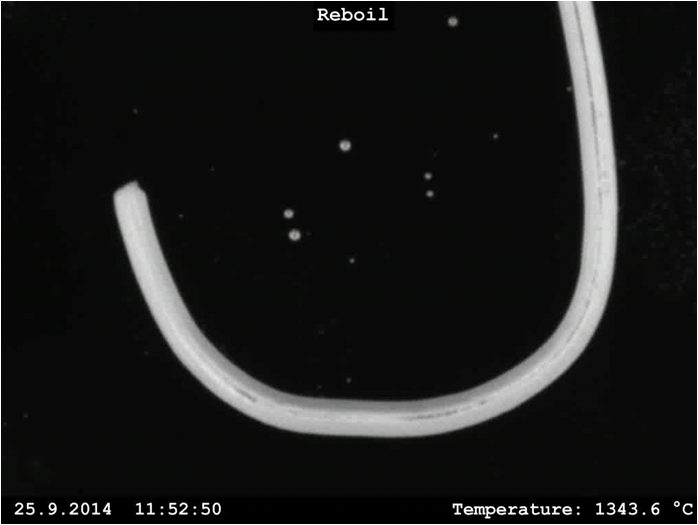
Example: Reboil observation
Reboil observation on Pt wire (Ø1 mm) – soda-lime glass
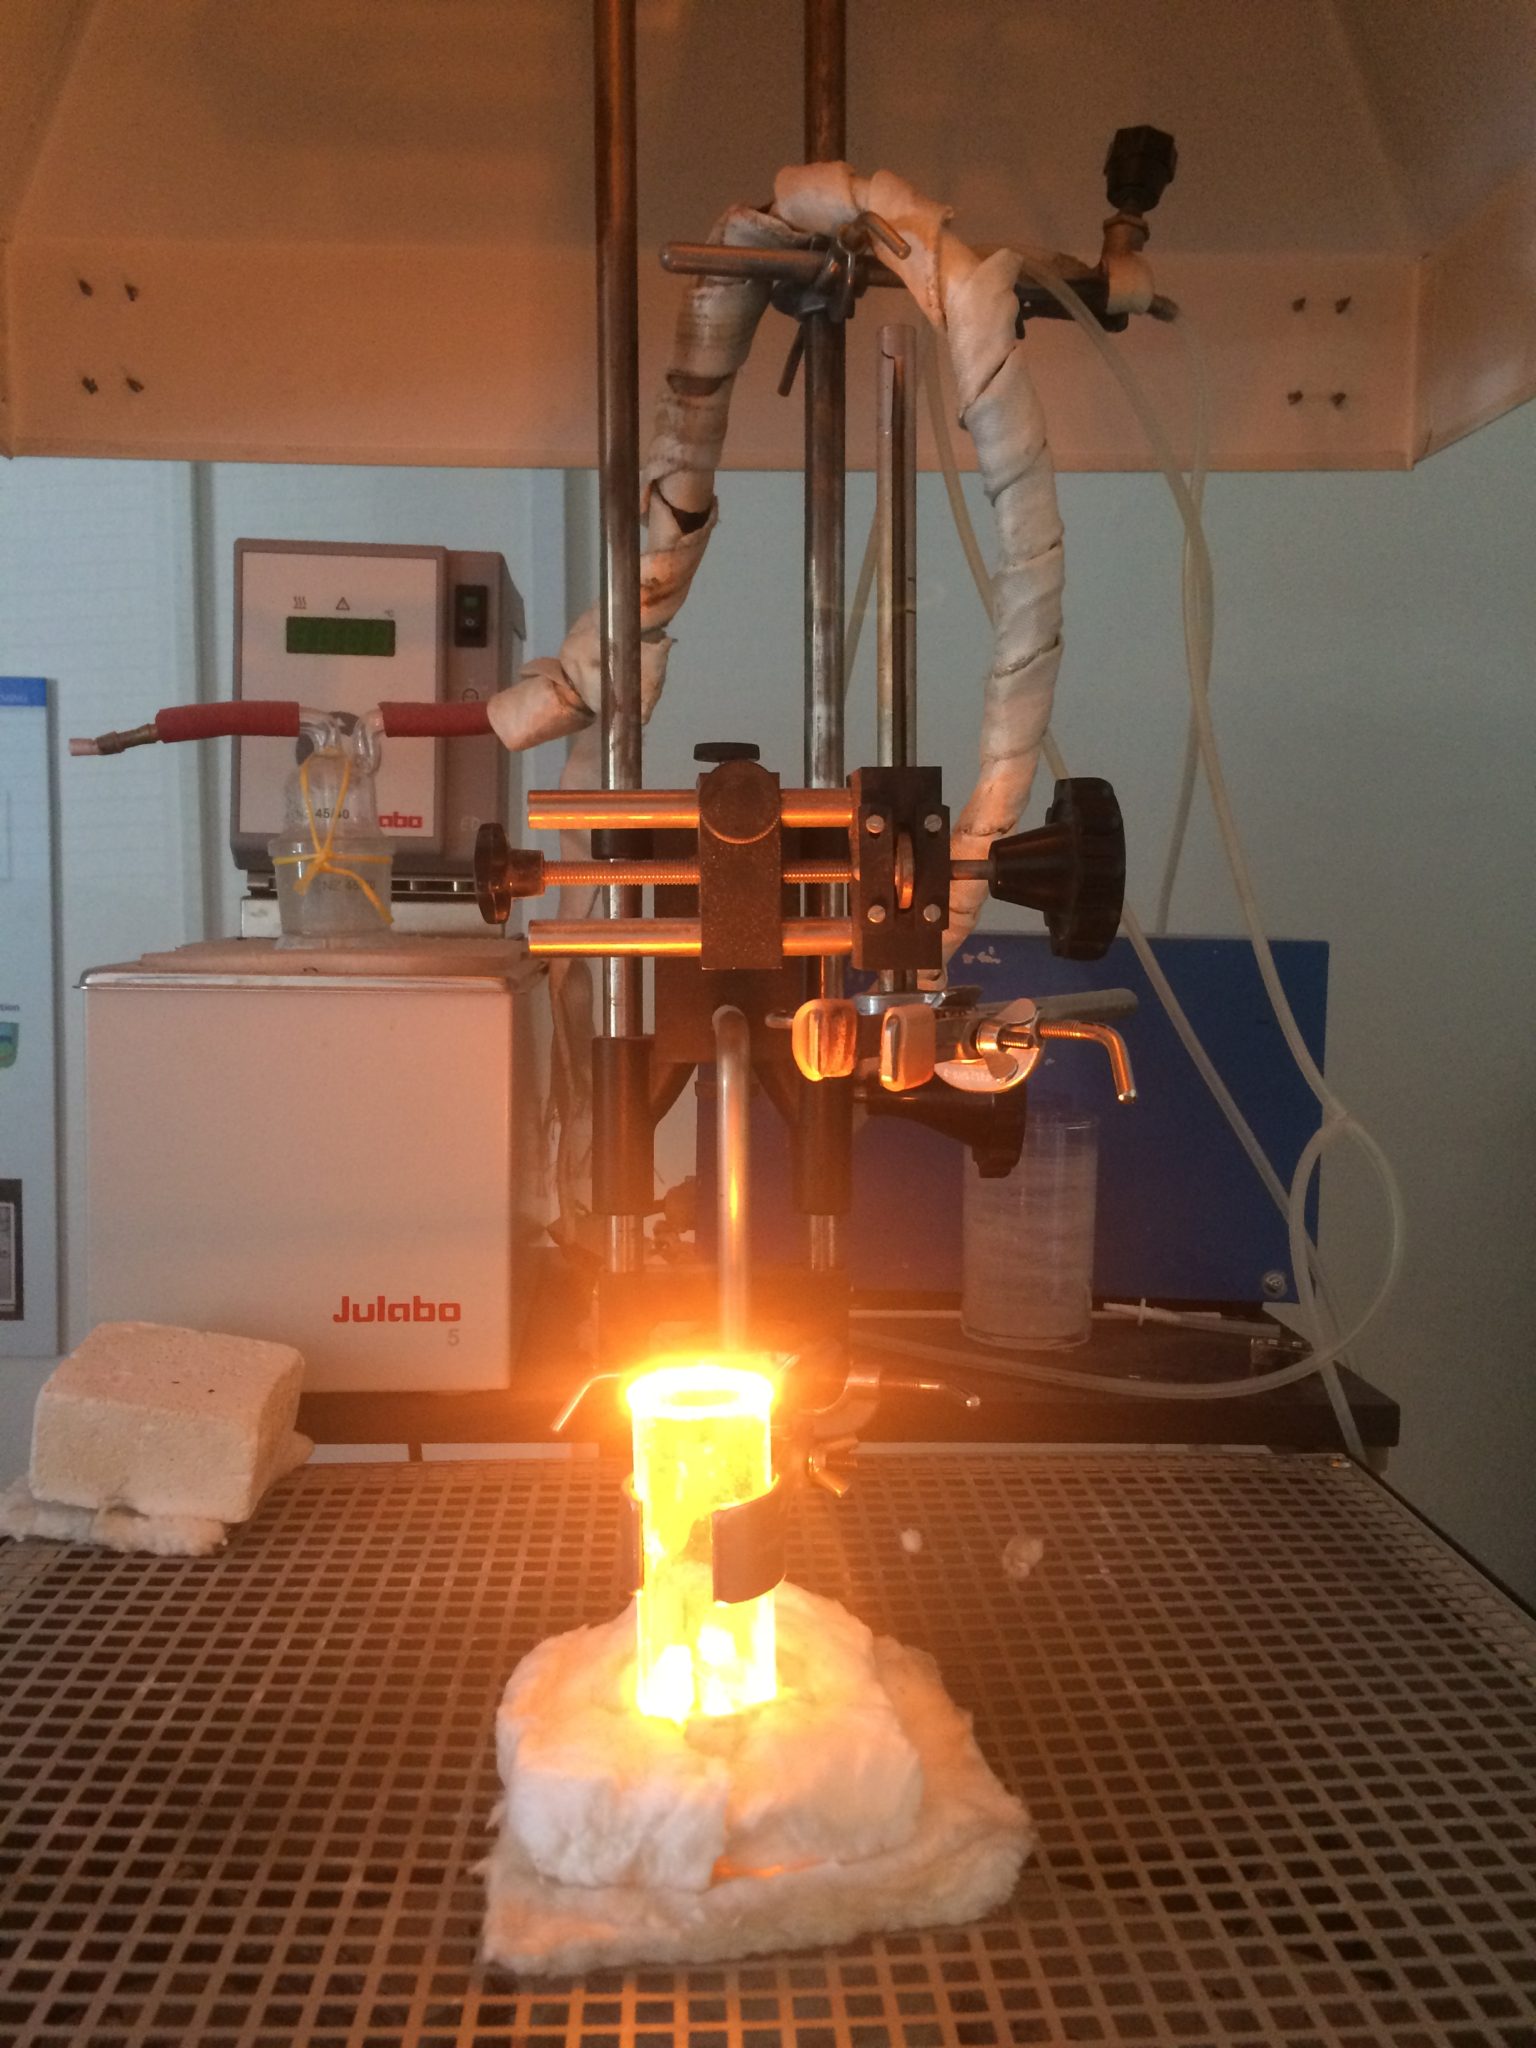
Example: Silica cell
Detail of silica cell at 1550°C
Further Information:
-
Please contact us to receive more information, our latest presentation, or a quotation to purchase.


